← All modules
Statistics & revenue

You know how the agency is doing without asking anyone

Production, commissions to collect, lead sources and agent rankings in a single dashboard. The numbers come from everyday work, not from a spreadsheet filled in at the end of the month.

Book a demo Request a quote
MyBrokerage Broker Statistics: the month's production data, charts and agent rankings
€102,400 in productionApril, from sellers and buyers
Agent rankingsUpdated from everyday work

Decisions based on data, not gut feeling

Output by agent

Each agent's listings, managed deals and production, ranked: team meetings start from shared facts.

Source performance

Which portal brings contacts that turn into viewings and which only phone calls: move spend to where it pays.

Commissions and revenue

Production from sellers and buyers, GCI to collect, binding offers and partial payments: you know what is still to come in.

Comparisons over time

Month on month, year on year and rolling 12 months: spot trends before they become a problem.

Inside Broker Statistics

The whole agency in one dashboard

This is the real MyBrokerage dashboard. Scroll: from the month's numbers to the agent rankings, all the way to the comparison with the previous year.
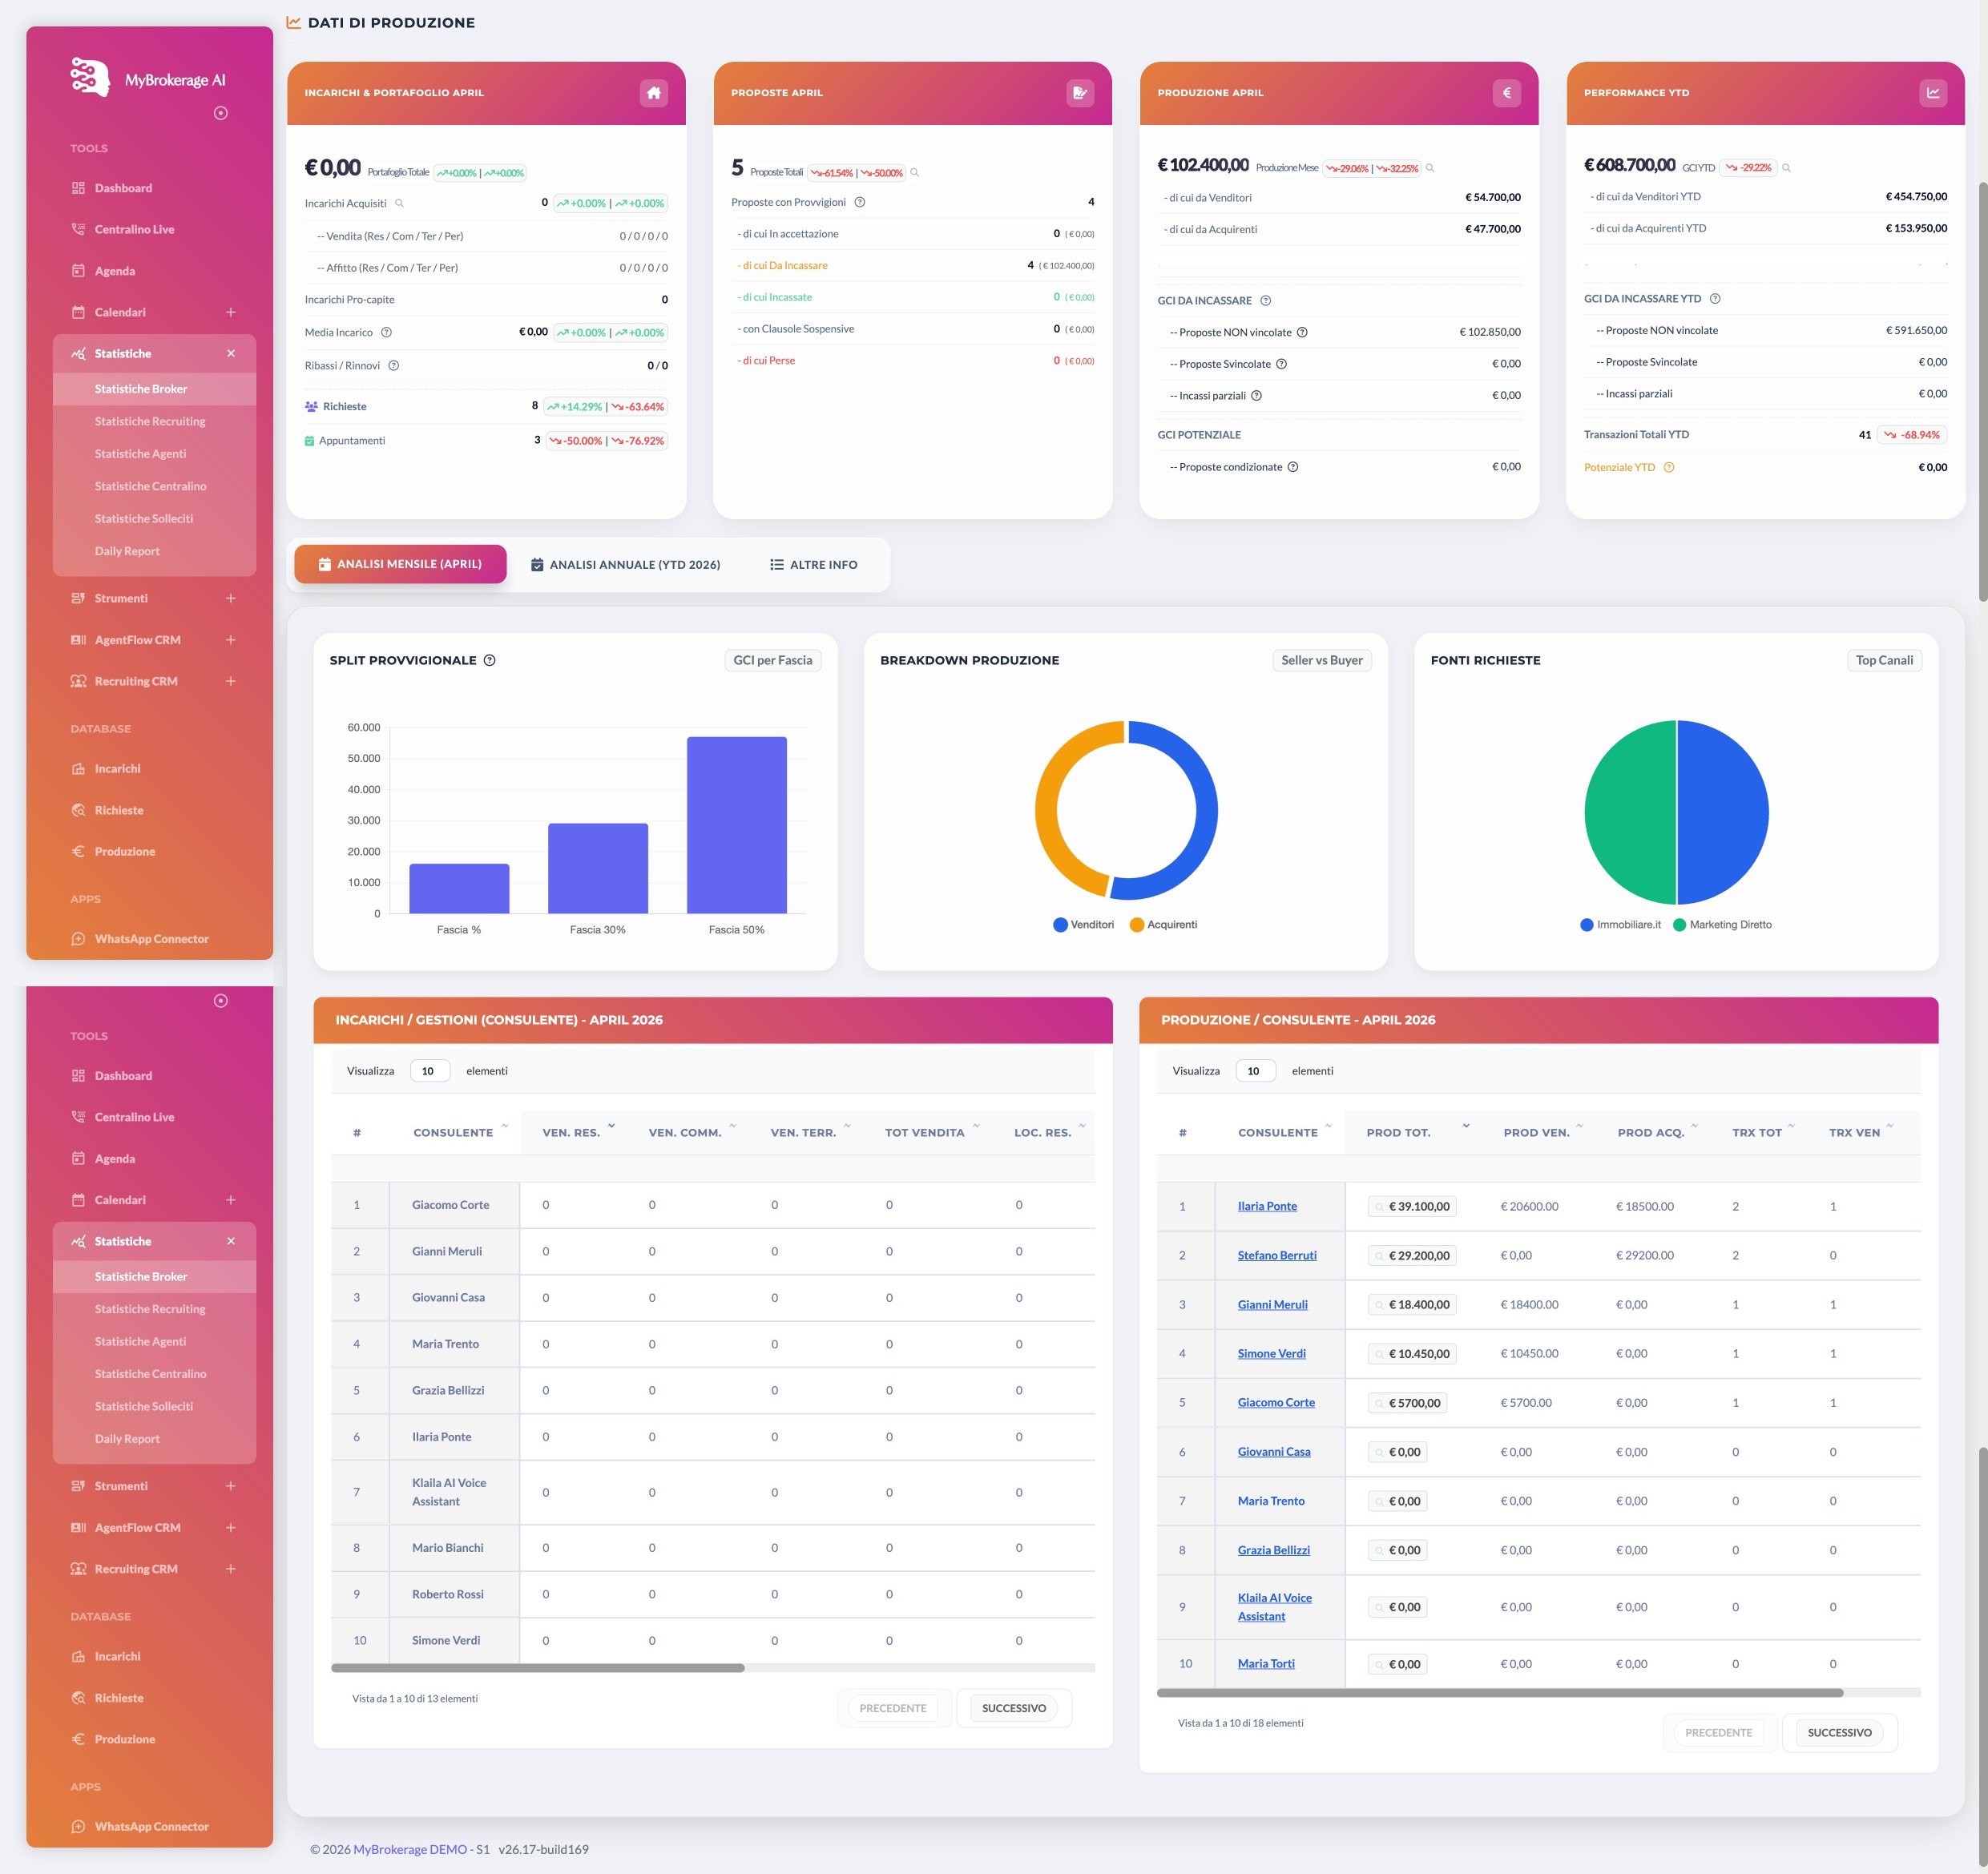
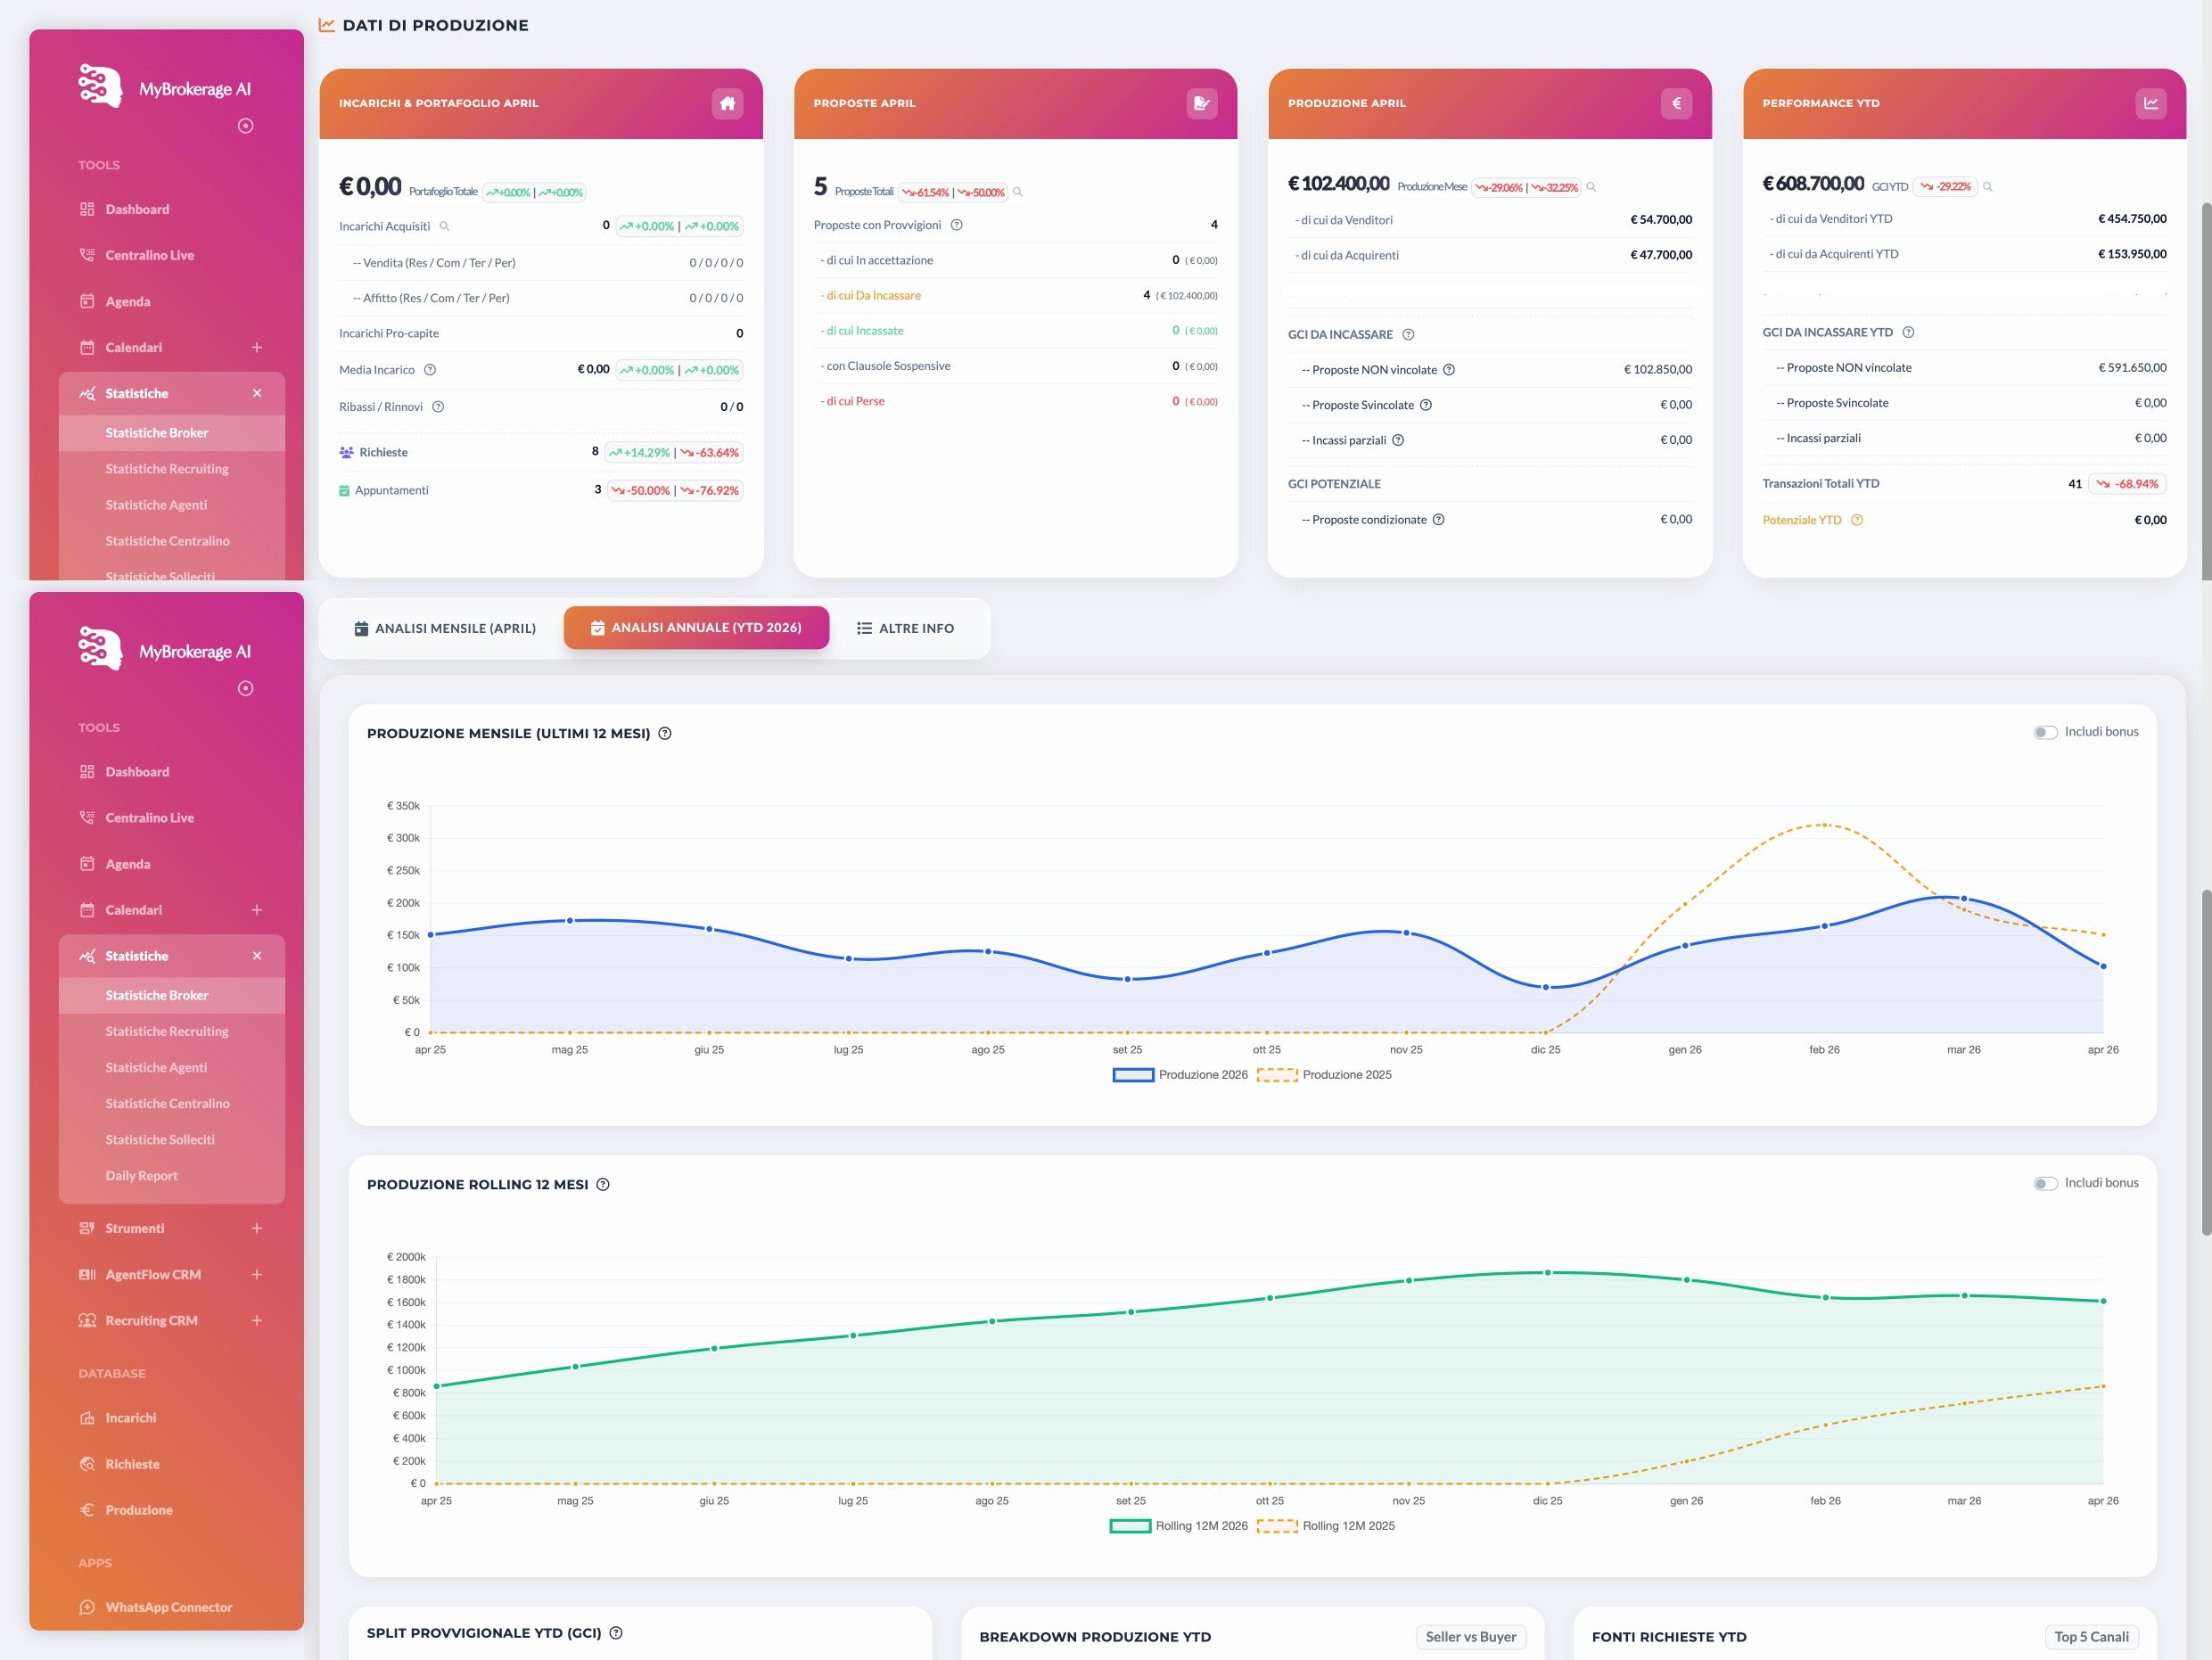
Broker Statistics, monthly analysis: production data, charts and agent rankings Broker Statistics, annual analysis: production over the last 12 months and rolling 12 months
Scroll to step into the dashboard
01Production data

The agency's month in four cards

Listings and portfolio, offers, monthly production and year-to-date performance: every number with its change versus the previous period.

02Monthly analysis

Where commissions and leads come from

Commission split by tier, production from sellers and buyers, lead sources: see straight away what's working.

03Rankings

Who delivers results, agent by agent

Each agent's listings, managed deals and production for the month, ranked: who is flying and who needs support, without Excel sheets.

04Annual analysis

Every month compared with the year before

Production over the last 12 months next to the previous year's: strong months and the ones to make up for stand out at a glance.

05Rolling 12 months

The real trend, without seasonality

The total of the last 12 months, updated month after month: see whether the agency is really growing, without being fooled by August or by one lucky month.

Where the numbers come from

Nobody compiles statistics by hand

Every call, outcome and offer the system records feeds the dashboard. The data is reliable because it's the same data agents work on every day.

See Property Workflow →

Which numbers do you want to see every Monday?

Tell us in the demo and we'll set up the management dashboard around them.

Book a demo Talk to us